Rounded square icon with a gradient blue to purple background featuring a black four-pointed star shape in the center.

Digitalização Industrial Simples e Escalável.

Transformamos processos desconectados em insights acionáveis. Uma visão de helicóptero sobre a produção - mais controlo, decisões informadas e resultados que se medem.

Dashboard displaying production forecast and KPI metrics for Cylinder Block Machining with AI assistant providing insight on Mixing area performance and machine downtime.
Envolva-se com o seu negócio

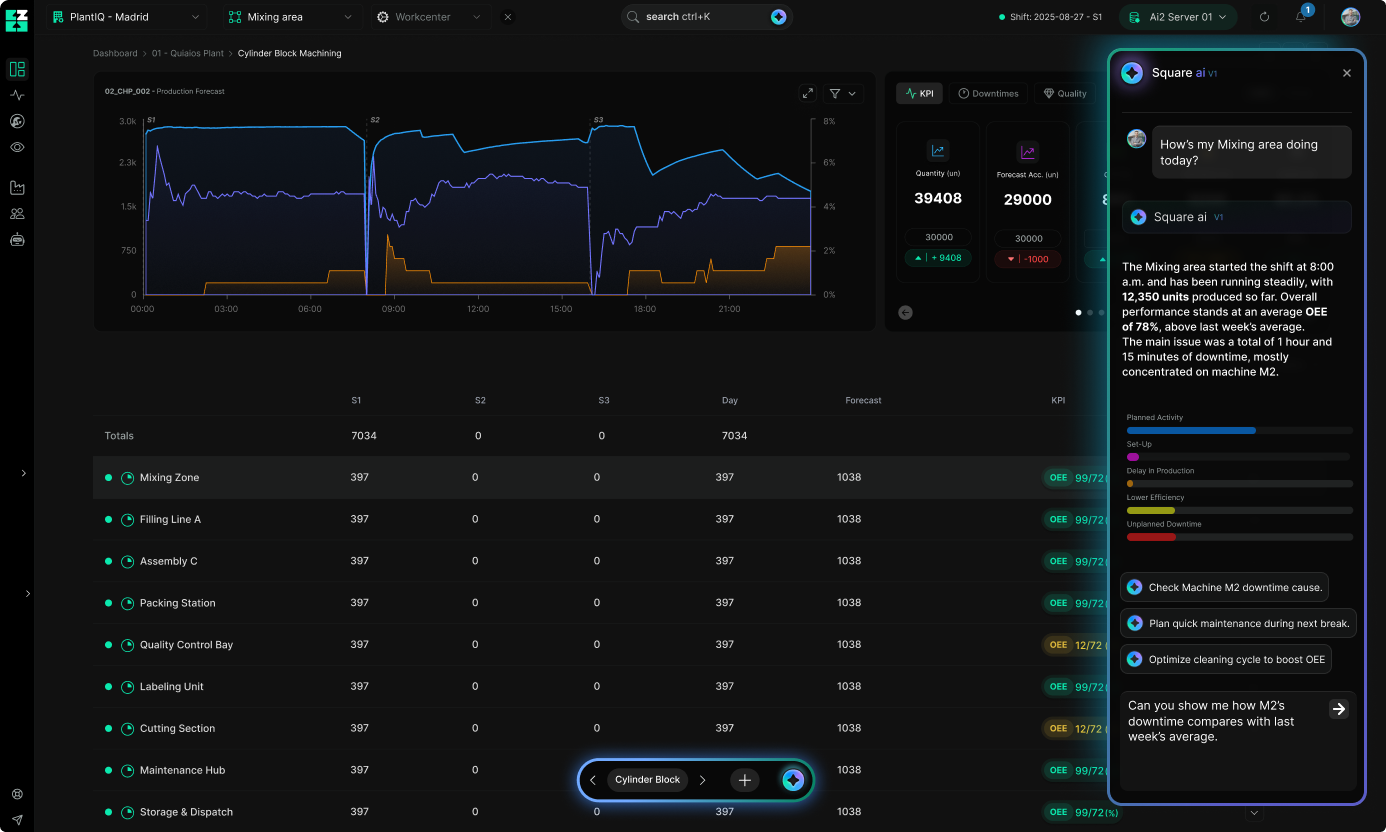
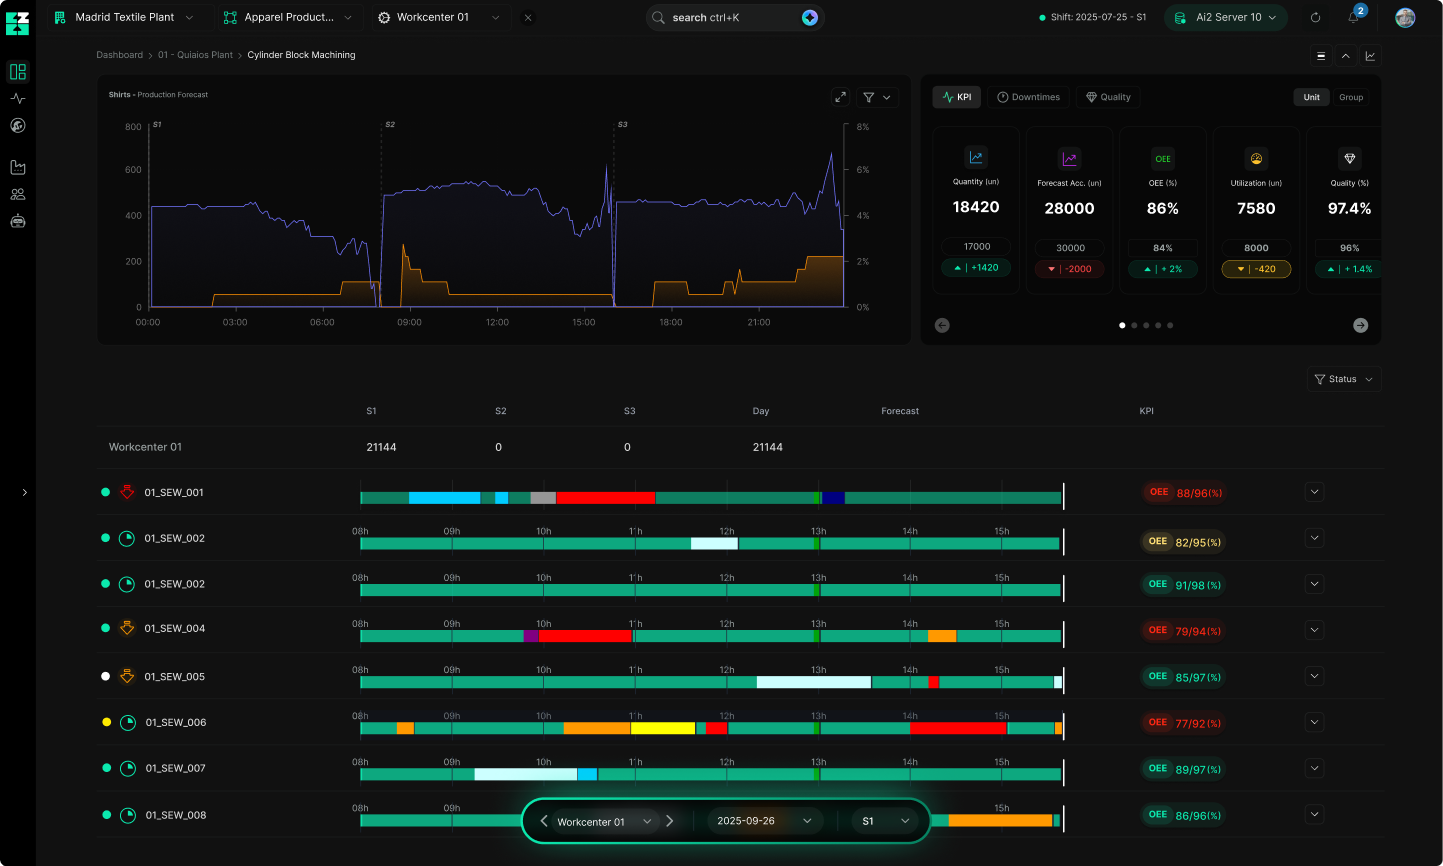
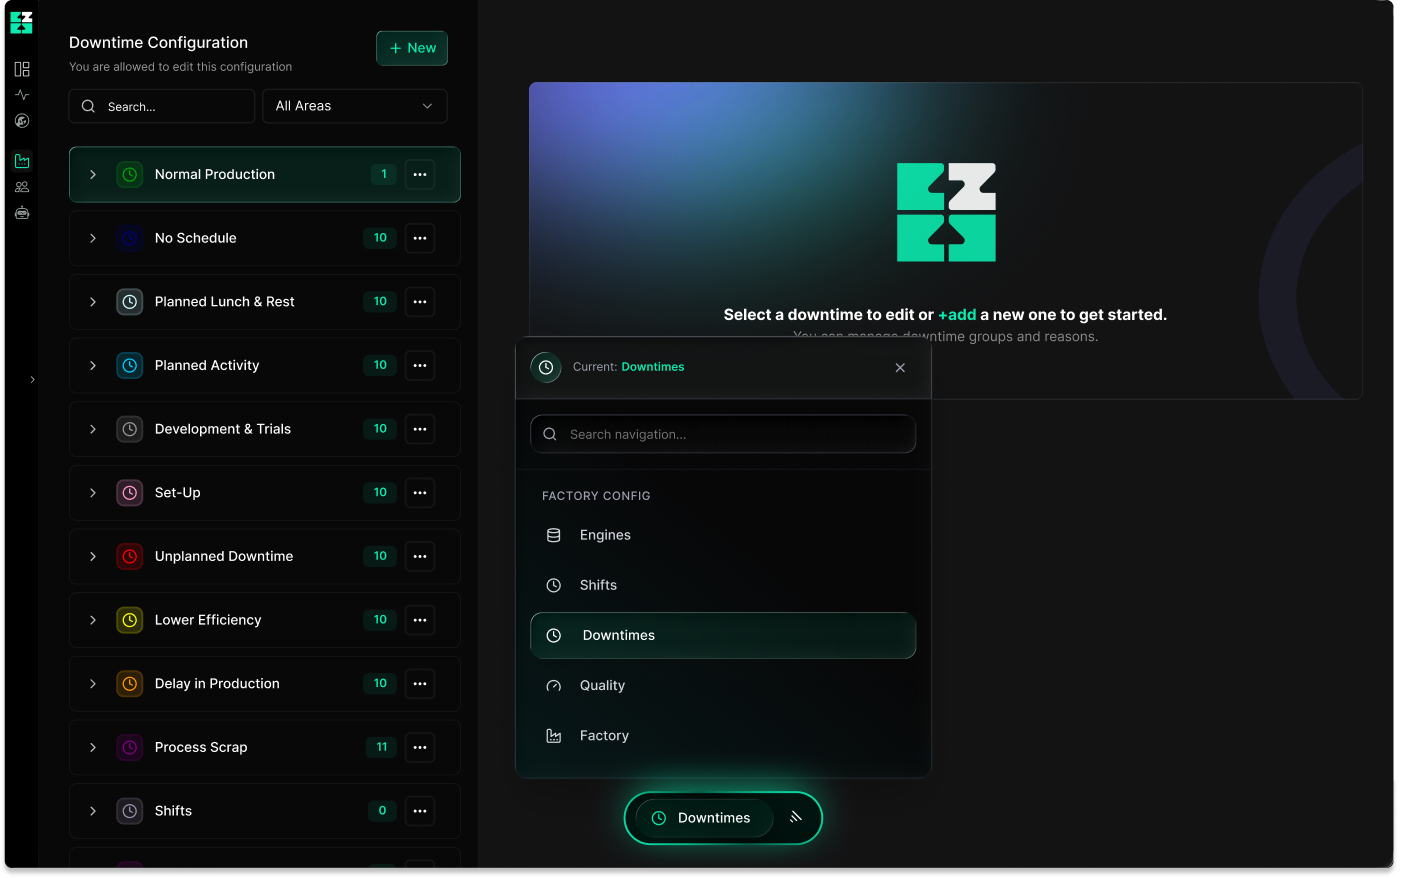
Uma visão em tempo real da produção, qualidade, manutenção, custos de energia e encomendas em risco.

Diagnóstico Guiado

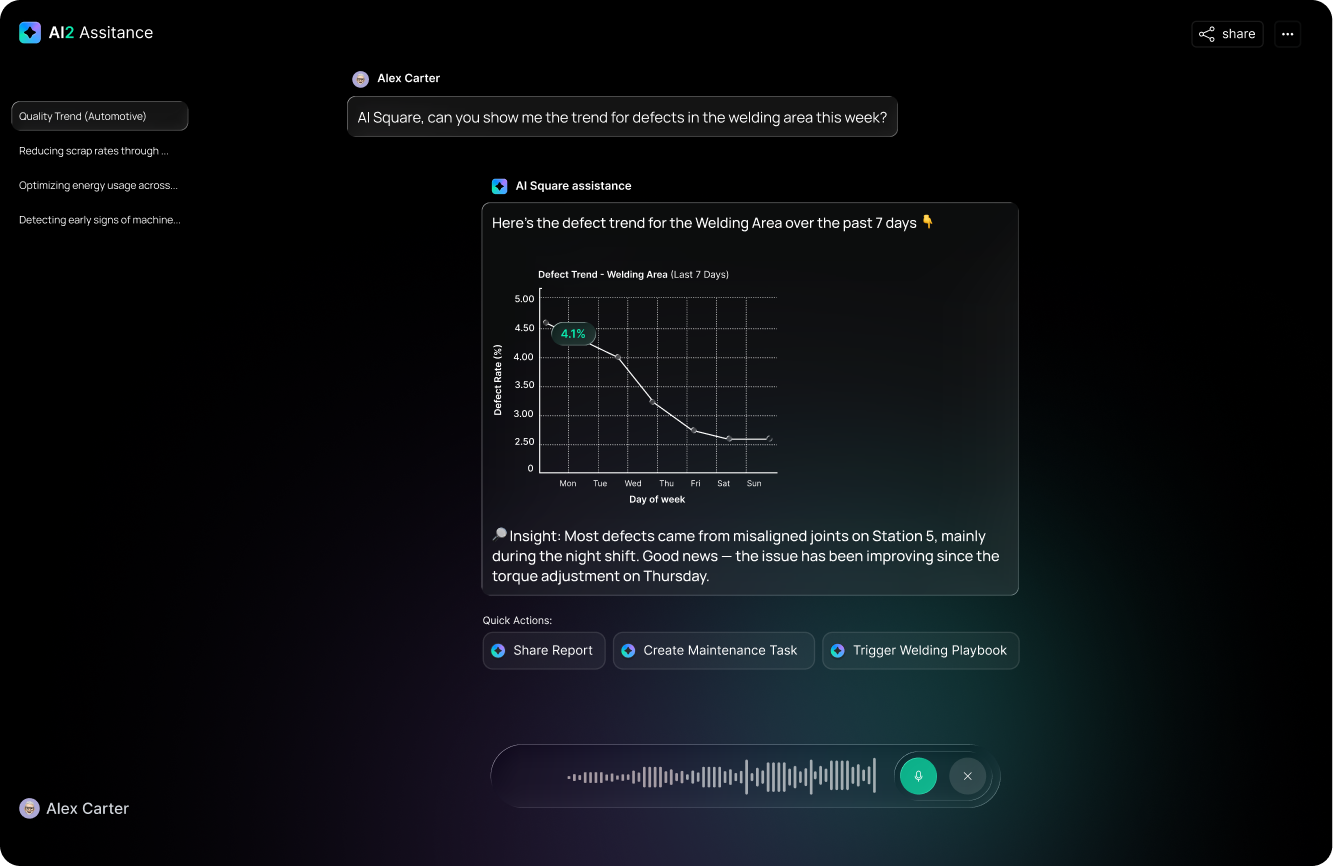
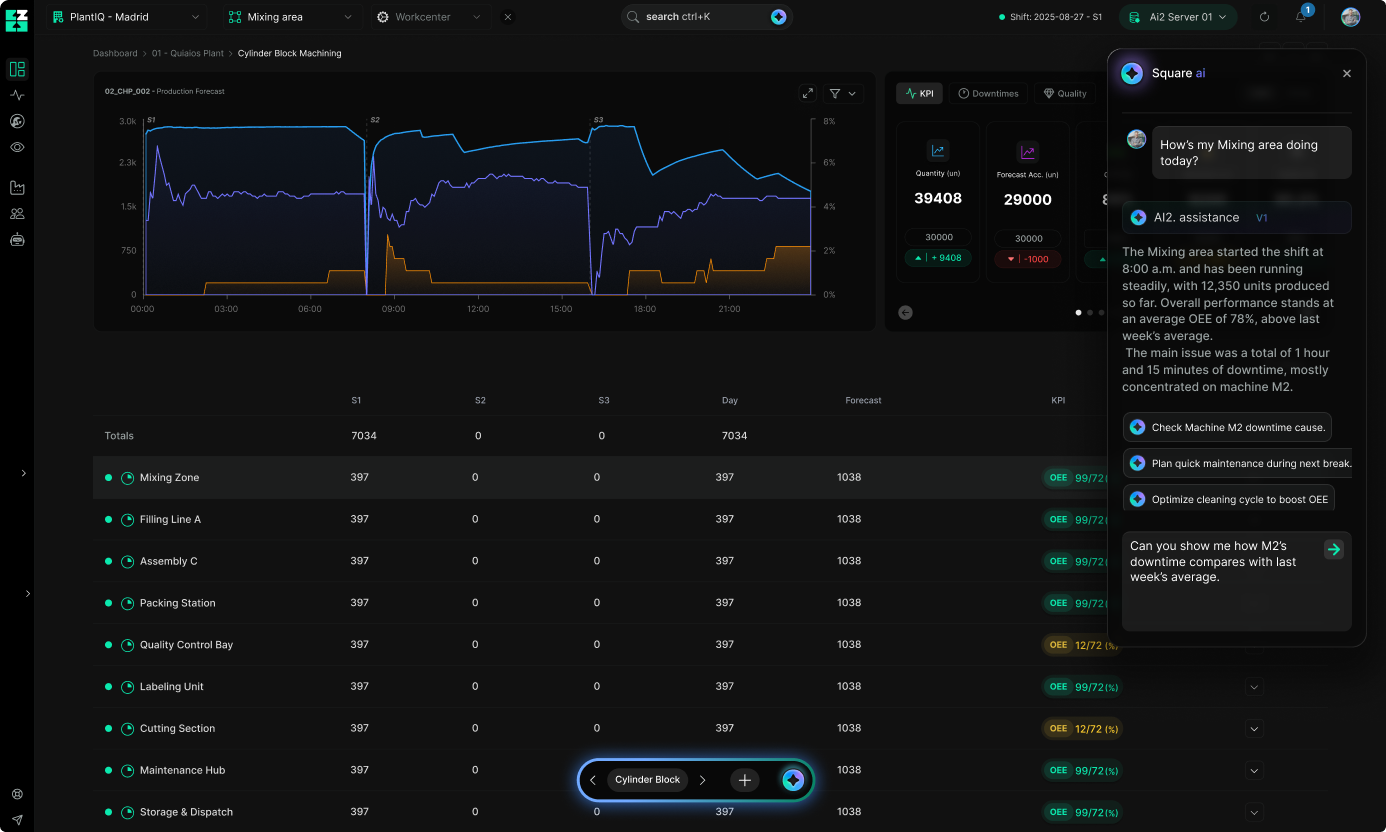
Dados contextualizados (evento + máquina + ordem + operador) revelam a causa provável.

Ação Guiada

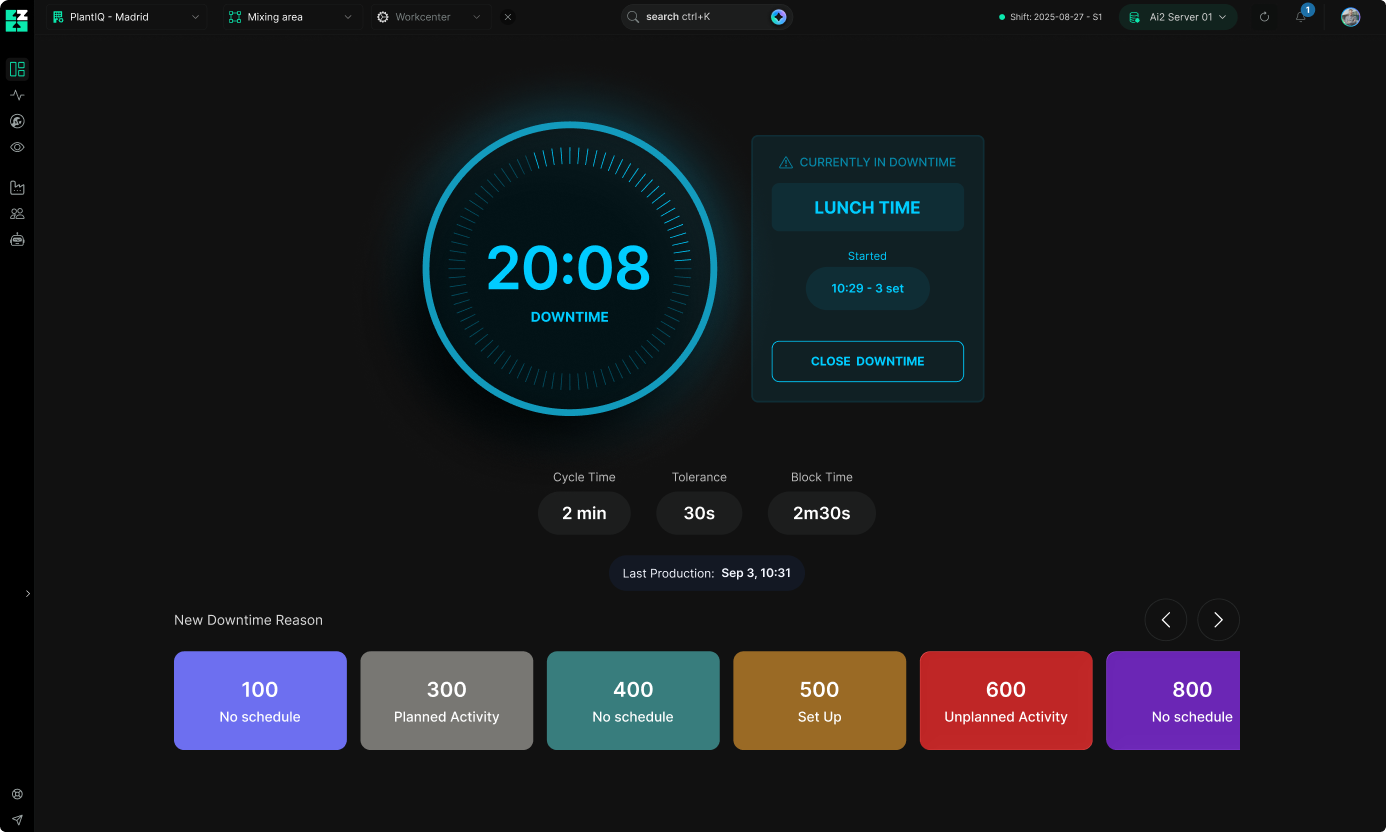
Priorize perdas, crie tarefas, ajuste o planeamento, compare casos semelhantes e aplique o playbook.

Downtime Sob Controlo

Detetar. Explicar. Corrigir.

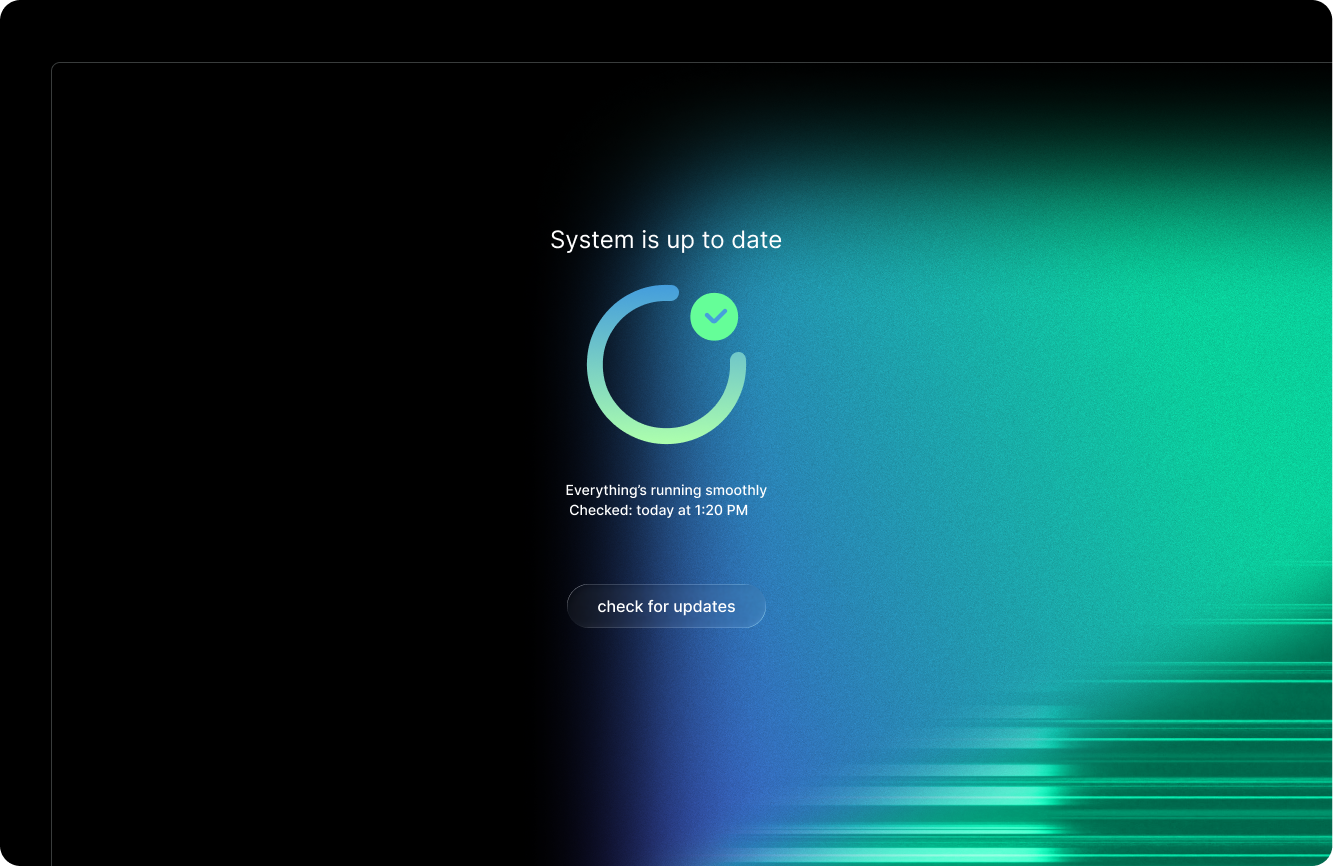
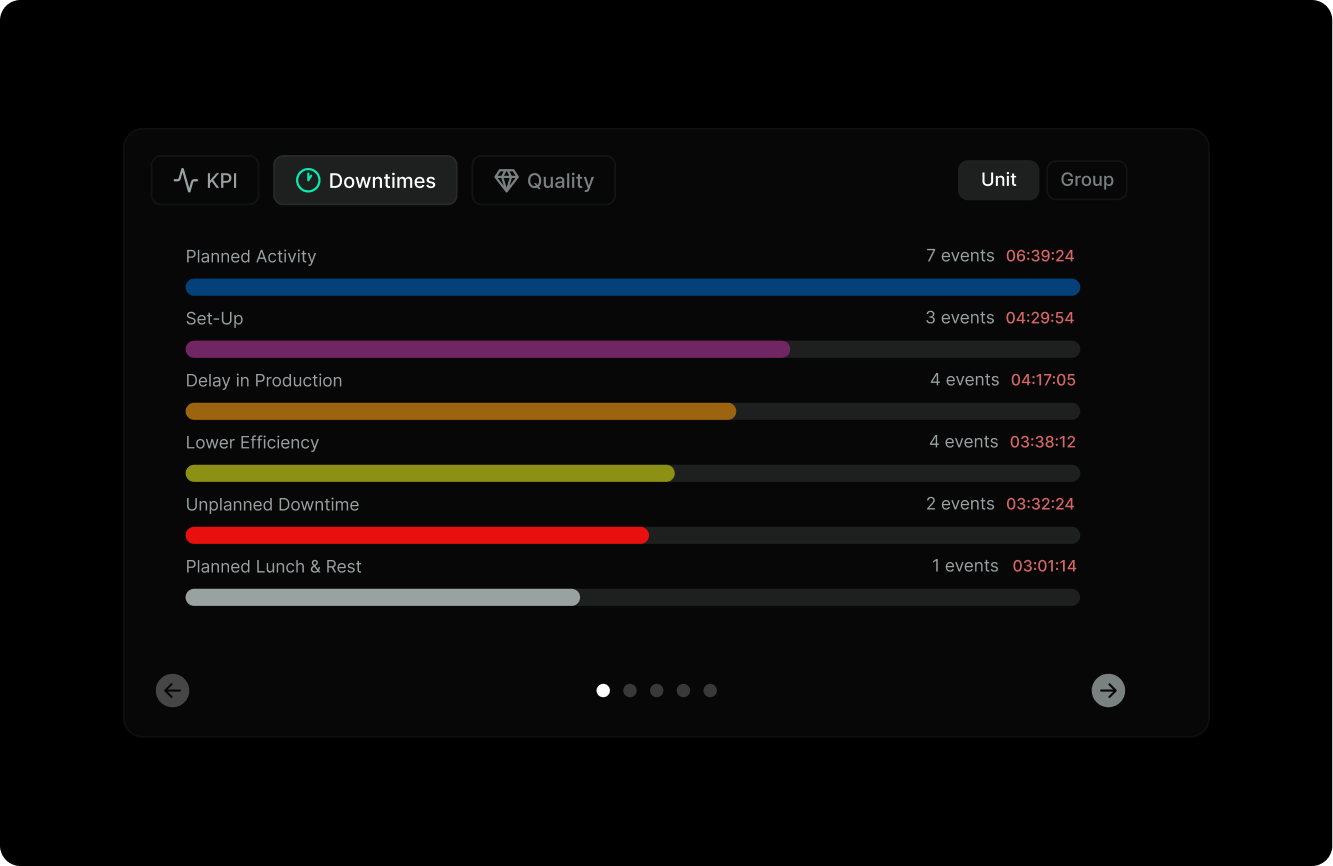
Monitorização contínua que reduz paragens, protege o OEE e mantém uma visão transversal de toda a operação.

Deteção Imediata

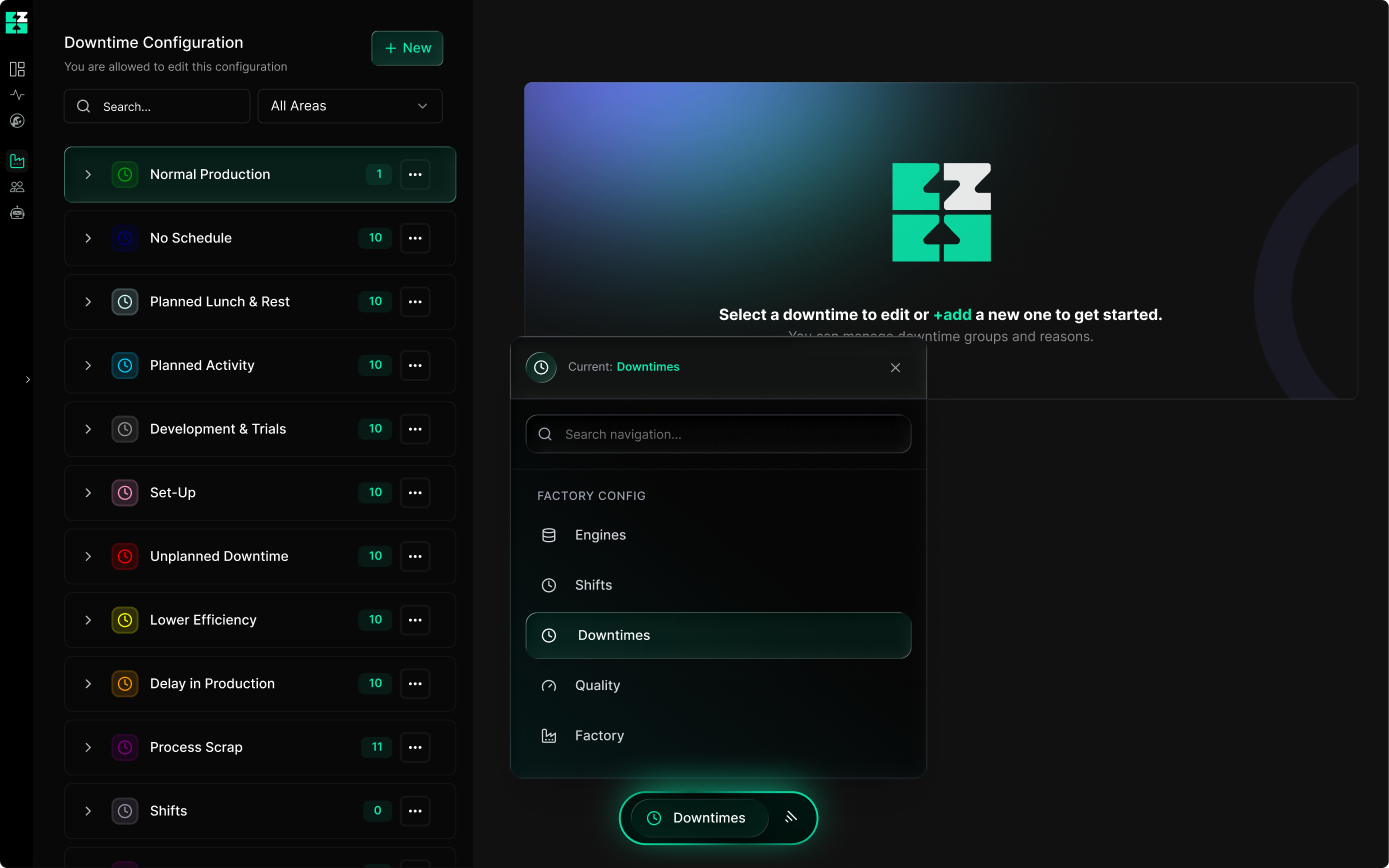
Desvios e eventos críticos são sinalizados em tempo real, permitindo antecipar encomendas em risco antes de afetarem o plano.

Causa Contextual

Toda a operação industrial interligada num único ecossistema, para compreender o que está por detrás de cada evento.

Recuperação Acelerada

Transforma dados de produção em playbooks e casos de referência que orientam equipas na correção mais rápida e eficaz.

Integração Industrial

Da origem ao insight: um modelo de dados comum.

Diagram showing AI Square Engine processing signals into three data categories labeled Data (x), Data (y), and Data (z), with colored blocks representing each data type.
Ligação sem fricção

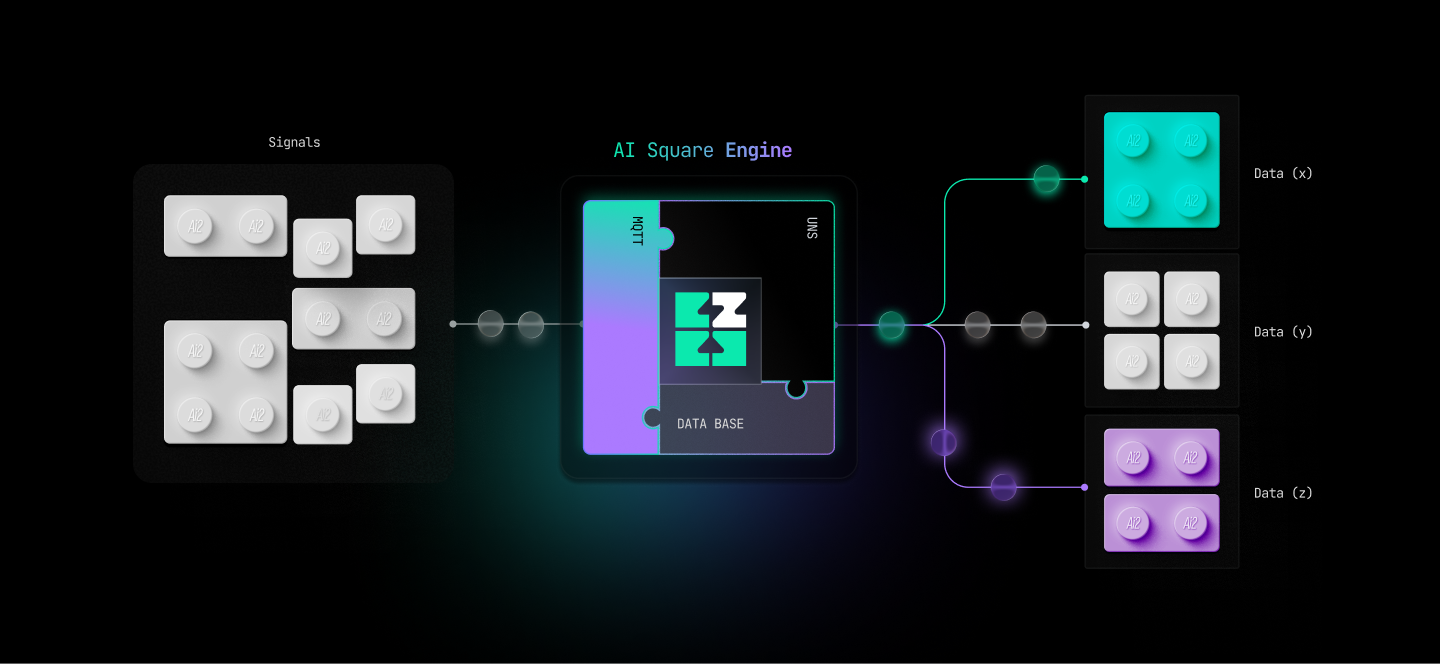
Integra facilmente OPC UA, MQTT, APIs e sistemas ERP/MES/SCADA já existentes.

Decisões com impacto

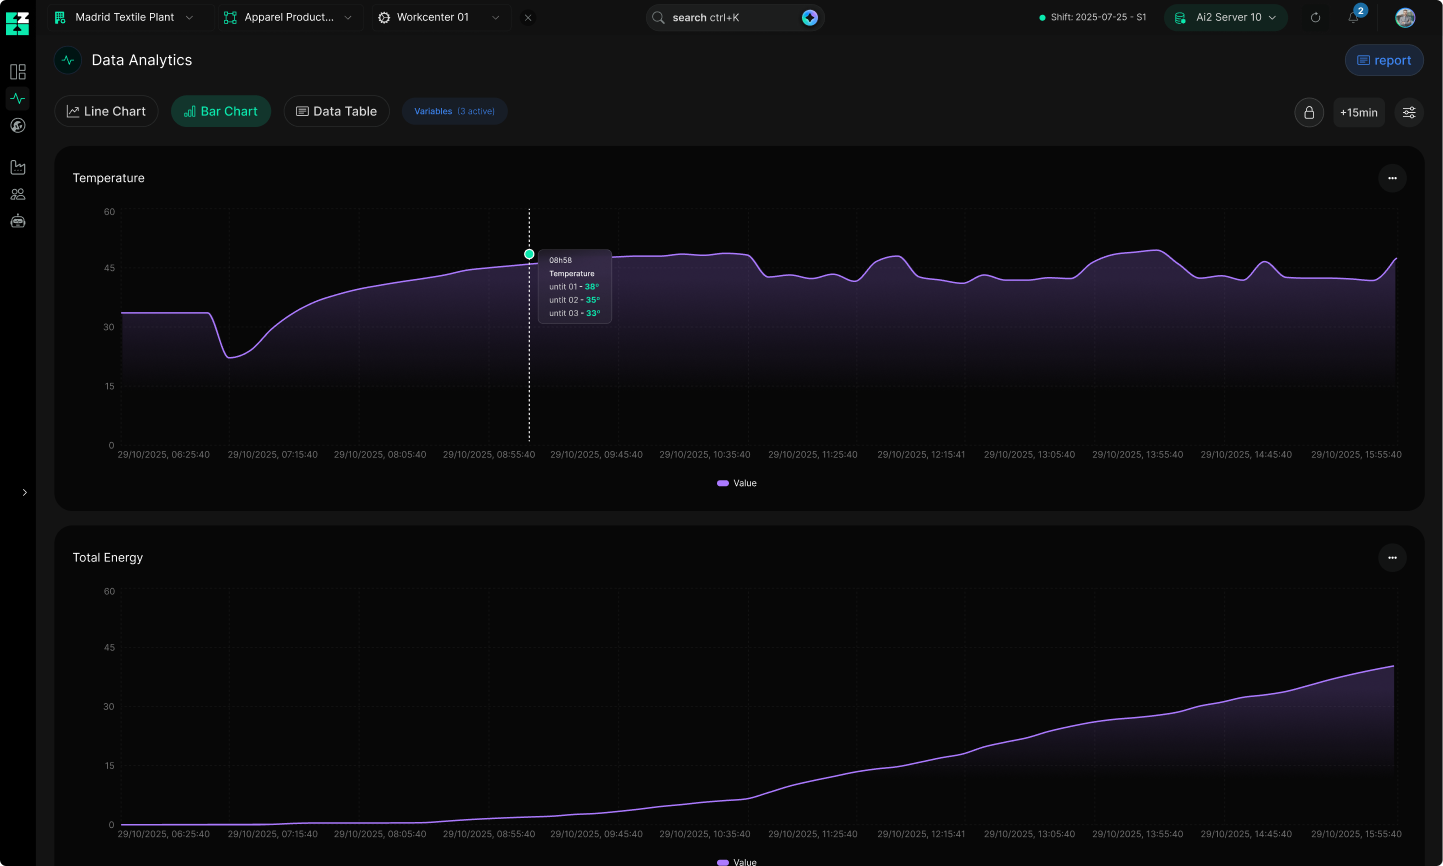
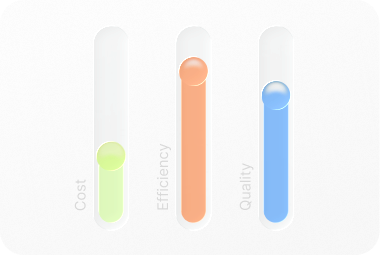
Identifica perdas, monitoriza OEE e custos por unidade em tempo real: sempre com uma visão global da produção.

Uma linguagem comum

Normalizamos toda a informação num único modelo de dados: eventos, perdas, qualidade, energia.

Soluções

Creating solutions
for people in industries

Ask about the status, losses, or risk in the plan. AI Square returns insights with visual proof and the next action—from the shop floor to management.

Chat interface showing a conversation where Alex Carter asks AI Square about welding defect trends. AI Square responds with a graph displaying defect rate percentages over the past 7 days, showing a decline from 4.1% on Monday to about 2.5% on Sunday, and provides insight that most defects originated from misaligned joints on Station 5 during night shifts, improving after a torque adjustment on Thursday. Quick action buttons for sharing report, creating maintenance task, and triggering welding playbook are below the chat.

Timelines by machine and KPIs (OEE, Quantity, Utilization, Quality) show where losses occur and on which machine, with drill-down for action.

Dashboard screen showing production forecast graph, key performance indicators, and timeline status bars with OEE metrics for various sewing machines at Workcenter 01 in Madrid Textile Plant.

Variables per piece such as temperature, pressure, and vibration are monitored. Clear patterns, early deviation detection, and reduced quality losses.

Data Analytics dashboard showing two line charts; the top chart displays temperature trends between 29/10/2025 06:25 and 15:55 with values mostly between 25 and 50, highlighting specific unit temperatures around 08:58. The bottom chart shows total energy rising steadily over the same period.

While analyzing, ask the AI for probable causes and next actions—quick decisions, supported by charts and connected to all production.

Dashboard showing Cylinder Block Machining production forecast graph, KPI metrics, and AI assistant chat summarizing Mixing area performance and downtime on machine M2.
Dashboard interface showing production forecast graph and performance statistics for Cylinder Block Machining with AI2 assistant chat providing shift status and maintenance suggestions.

The Configurator provides no-code management; we ensure updates, security, and compatibility without lock-in.

Downtime Configuration interface showing a list of downtime categories like Normal Production, No Schedule, and Planned Activity, with a highlighted navigation menu on Downtimes and an option to add new downtimes.
Dashboard interface for downtime configuration with a sidebar listing downtime categories and a main panel to select or add downtimes.
Solução

Digitization framework: quick value,
predictable scale

Our methodology

Leave complexity behind. Unlock growth.

Digital transformation fails when complexity leads. At AI Square, we simplify first and scale intelligently.

2x2 matrix chart with Impact on vertical axis and Effort on horizontal axis, divided into four quadrants labeled Quick Wins, Strategic Scaling, Marginal Improvement, and Low Priority.

Quick Wins

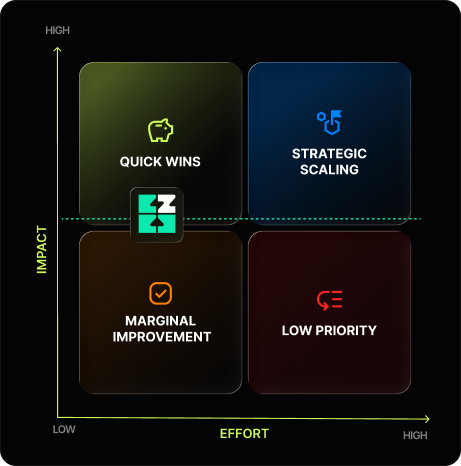
Baixo esforço, alto impacto. Resultados criam tração para o roadmap.

Interface showing two rounded rectangular buttons with numbers; top button displays 30000 in gray, bottom button displays a green upward arrow and +10000 with text +10% current production below.

Strategic Scaling

Phased digital transformation, clear processes, and sustainable expansion.

Three vertical sliders labeled Cost, Efficiency, and Quality with indicator knobs set low, high, and medium respectively on a gray background.

Marginal Improvement

Fine-tuning after scaling: standardize what works and consolidate gains.

Bar graph showing percentage increase over 1, 10, 20, and 30 days with blue and gray stacked bars, blue bars increasing in height.

Low Priority

Focus on what matters: we eliminate the noise and concentrate resources.

Archery target showing concentric rings with a yellow center labeled 100 points.
System Management

Simple configuration, total control

The risk of "homemade solutions"

When those who built them leave, the knowledge leaves with them. Without updates or documentation, small failures turn into stoppages and costs.

Bar chart showing downtime events and durations by category: Planned Activity has 7 events (6:39:24), Set-Up 3 events (4:29:54), Delay in Production 4 events (4:17:05), Lower Efficiency 4 events (3:38:12), Unplanned Downtime 2 events (3:32:24), and Planned Lunch & Rest 1 event (3:01:14).

Configure, don’t program

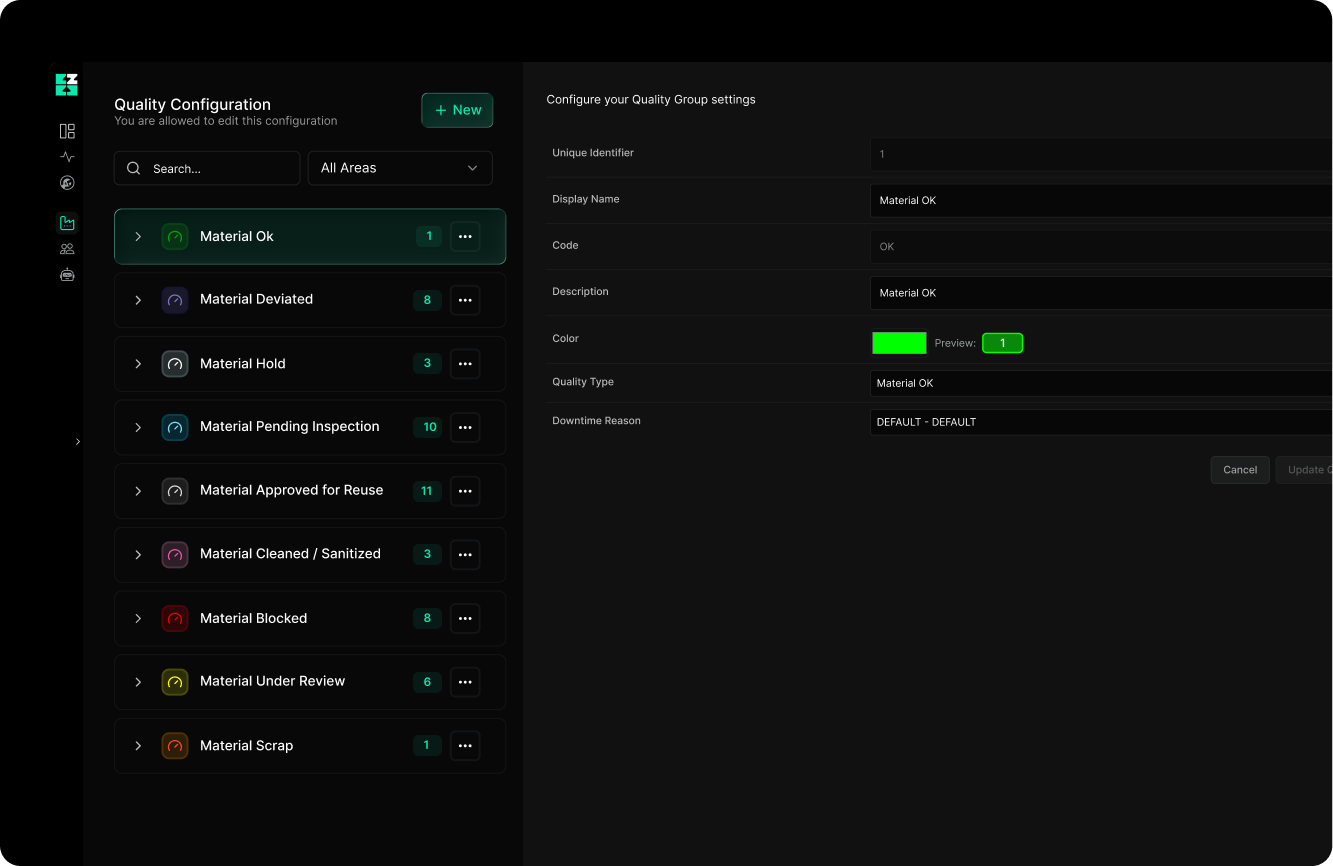
With the Configurator, your team can adjust rules, indicators, and hierarchies without writing code. Everything includes a change history and the ability to revert changes.

Quality configuration interface displaying a list of material status categories on the left and editable settings for 'Material OK' on the right, including unique identifier, display name, code, description, color preview, quality type, and downtime reason.
Guaranteed continuity

The knowledge remains on the platform. We ensure updates, security, and compatibility. Teams may change; the system continues.

System update screen showing 'System is up to date' with a circular checkmark icon and a button labeled 'check for updates'.

Leave complexity behind.
Unlock growth.

Frequently Asked Questions

Whether you are looking to streamline your operations, enhance productivity, or drive growth, we have the expertise and innovation to help you achieve your goals.

What makes AI Square different from other digitalization platforms?

AI Square offers a truly modular and scalable approach, allowing businesses to start small and expand as ROI is generated. Unlike competitors, we provide transparency, flexibility, and real-time actionable insights without excessive IT complexity.

How long does it take to implement AI Square?

Our plug-and-play integration ensures that businesses can start seeing results quickly. The initial setup can be completed in days, not months, provided that the factory or client infrastructure is already prepared with machine connections and data accessibility. If additional setup is needed, our team will guide you through a streamlined process to ensure smooth integration.

How does AI Square ensure a positive ROI?

Our methodology is designed around progressive implementation. You make an initial investment, measure the impact, and then reinvest based on the ROI achieved. This self-financing approach minimizes risk and maximizes efficiency.

Is AI Square compatible with my existing systems?

Yes! AI Square is designed to integrate seamlessly with your current industrial systems, ERP software, and IoT infrastructure, eliminating the need for costly system overhauls.

What industries benefit the most from AI Square?

Our platform is adaptable across manufacturing, logistics, energy, and other industrial sectors, providing tailored solutions for each business's unique needs.

Do I need an in-house IT team to manage AI Square?

Not at all. AI Square is built for simplicity, with minimal IT dependency. Our team provides dedicated support and continuous optimization to ensure smooth operations.

How does AI Square handle data security?

We use industry-leading security protocols, including encryption and compliance with global data protection regulations, ensuring your data remains safe and confidential.

What kind of training and support do you offer?

We provide hands-on training sessions, ongoing support, and best practice guidance to ensure your team can fully leverage AI Square’s capabilities.

How do I get started with AI Square?

Simply book a call with our team, and we’ll help design a tailored digitalization strategy for your business.